Vibration contour plot module
This tool enables vibration simulations to assess the impact of equipment-induced vibrations on the surrounding environment and on sensitive targets. It is developed by the Advanced Technology and Research (ATR) Competence Center at Haskoning as part of the AT&R software package.
Warning
The Vibration Contour Plot module is currently under active development. Functionality may change in future updates, and formal validation is still pending. Please verify your results carefully before using them in critical applications.
Getting Started
Before you start with the Vibration Contour Plot module, make sure to install the latest version of the AT&R package. Refer to ATR installation guide.
This section introduces the basic workflow for using the vibration contour plot tool. Before diving into an example, here are the core ideas:
Simulation: Represents the central simulation tool for the assessment.
VibrationSource: Defines the equipment producing vibrations in the assessment.
Target: Defines locations to assess for certain vibration limits.
Example - Basic Usage
This example shows the basic usage of the tool.
Start the project with the following code:
from haskoning_atr_tools import ATRProject
project = ATRProject(name='My Project', location='Building location', project_code='XXXX')
Provide the folder where you want to collect the results from the simulation.
project.results_folder = rf'C:\Users\xxxxxx\Documents\YourProject\Results'
Step 1 - Define the equipments in the project
Load the data for the equipments in the project. You can provide the data in the default structure or provide a custom
mapping for the data. Use function
create_equipments_from_file().
project.create_equipments_from_file(
    file_path=equipment_excel_path, sheet_name='equipments', activity_filter='continuous')
The equipment are the sources of the vibrations in the simulation. For these the following properties should be provided (some of the properties are optional). A template for the equipment inputs can be downloaded here (sheet for equipments):

Example Excel for equipment inputs.
The inputs in the Excel are described in the following table.
Input |
Type |
Unit |
Description |
|---|---|---|---|
Name |
str |
[-] |
The name of the equipment. |
ID |
int |
[-] |
The identifier of the equipment. |
Calculate |
bool |
[-] |
Select if the equipment should be used in the calculation. |
X, Y, Z coordinate |
float |
[m] |
The coordinates of the equipment’s location. |
Vibration source level |
float |
[dB] or [m/s] |
The source vibration level emitted by the equipment. |
Unit |
str |
[-] |
Specifies the unit of the vibration source level in ‘dB’ or ‘m/s’. |
Center frequency |
float |
[Hz] |
The center frequency of the vibration range the equipment produces. |
Min frequency |
float |
[Hz] |
The minimum frequency of the vibration range the equipment produces. |
Max frequency |
float |
[Hz] |
The maximum frequency of the vibration range the equipment produces. |
Flat noise |
float |
[%] |
Percentage of flat noise added to the vibration signal. |
Activity |
str |
[-] |
Description of the activity or operational state of the equipment. Select from ‘continuous’, ‘intermittent’ or ‘emergency’. |
A filter can be applied on the activity column, to only load the equipments active in certain situations for the simulation.
Note
The vibration source level is always stored in the instance in decibel, [dB].
Step 2 - Define the targets in the project
The next step is to load the data for the targets. These are the points of interest, and might be the locations of the vibration sensitive equipments for which the assessment is executed. A template for the target inputs can be downloaded here (sheet for targets):

Example Excel for target inputs.
Use function
create_targets_from_file() to load the
Excel-file with the properties of the targets. This can be the same Excel as the one with the equipments, just specify
the correct sheet-name. It is possible to provide a custom mapping for the data.
project.create_targets_from_file(file_path=target_excel_path, sheet_name='targets')
The inputs in the Excel are described in the following table.
Input |
Type |
Unit |
Description |
|---|---|---|---|
ID |
int |
[-] |
The identifier of the target. |
Calculate |
bool |
[-] |
Select if the target should be used in the calculation. |
X, Y, Z coordinate |
float |
[m] |
The coordinates of the target’s location. |
Name |
str |
[-] |
Optional: The name of the target. The targets in the simulation are identified by their ID, name is only used for plotting. |
Category |
str |
[-] |
Optional: The category of the target. This is a property of the specification supplier, but currently not used in the tool. |
Type |
str |
[-] |
Optional: The type is used when adding vibration limits to the target, as these can be specified per type. |
To add the vibration limits use the following function
load_target_limits_from_file() to link
limits based on the equipment type.
project.load_target_limits_from_file(
    file_path=target_limits_excel_path, sheet_name='target_limits', limit_type='velocity')
You can specify different limits for the different target types in the model. The name of the limit range is matched to the type names in the model. The limits are added to the target if these match. Currently, only velocity limits have been implemented.
A template for the target inputs can be downloaded here (sheet for target_limits):
Example Excel for target limits inputs.
This can be the same Excel as the one with the equipments, just specify the correct sheet-name. It is possible to provide a custom mapping for the data.
Step 3 - Perform simulation
The simulation requires a mesh, which can be created with the
generate_constrained_mesh() function. This
function requires the x- and y-range for the plot and the maximum dimension of the mesh-element area (influencing the
precision vs performance). The function generates a 2D mesh.
project.generate_constrained_mesh(x_range=(-100, 800), y_range=(-100, 800), mesh_area=100)
The simulation also requires a material definition. Currently only one material can be used in the model.
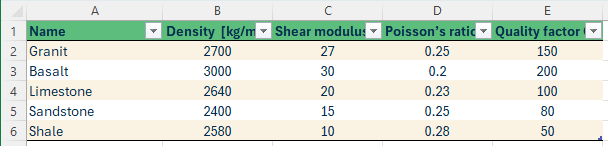
Example Excel for material inputs.
Use function
create_materials_from_file() to load
the Excel-file with the properties of the materials. This can be the same Excel as the one with the equipments, just
specify the correct sheet-name. It is possible to provide a custom mapping for the data.
The inputs in the Excel are described in the following table.
Input |
Type |
Unit |
Description |
|---|---|---|---|
Name |
str |
[-] |
The name of the material. |
Density |
float |
[kg/m3] |
Density of the material in the simulation. |
Shear modulus |
float |
[GPa] |
Shear modules of the material in the simulation. |
Poisson’s ratio |
float |
[-] |
Poisson’s ratio of the material in the simulation. |
Quality factor |
float |
[-] |
Quality factor of the material in the simulation. |
The mesh and material is combined in the simulation, together with the information on the targets and vibration sources
defined in the previous steps. The simulation is created with the
create_vibration_simulation()
function.
vibration_simulation = project.create_vibration_simulation(
    name='vibration_simulation_1', material=materials['sandstone'])
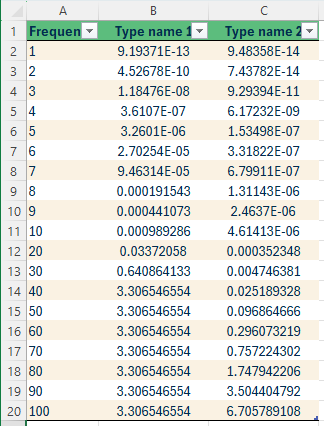
Before executing the analysis, the frequency data of the vibration sources should be generated. Execute the
create_frequency_domain_data_from_equipments()
function to add the frequency data. You need to specify the sampling-rate, which influences the accuracy and performance
of the analysis.
project.create_frequency_domain_data_from_equipments(sampling_rate=1)
Then the simulation can be executed with the
calculate_level_per_node_per_source()
method of VibrationSimulation class. Select what amplitude type you want the results in, in this example we use decibel
for the vibration level.
vibration_simulation.calculate_level_per_node_per_source(amplitude_type='decibel')
Step 4 - Assessment of the results
Generate the spectra at the location of the targets in the simulation in one graph. You can select to generate the plot
in velocity (m/s) or vibration-level (dB). The function
plot_f_spectrum_all_targets() can be used for
these plots.
project.plot_f_spectrum_all_targets(amplitude_type='velocity', log_scale_x=True)
The user can select to add the vibration requirements and further customise the plot.
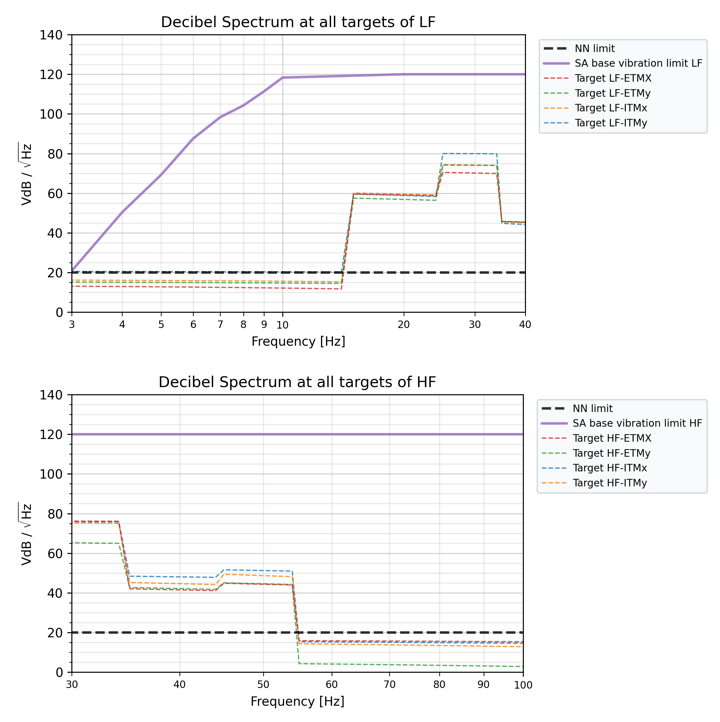
Example plot of the vibration level spectra at all targets.
The contour plots can be generated with the function
plot_contour(). Or the governing contour plot
with plot_governing_contour().
project.plot_governing_contour(
    vibration_simulation=vibration_simulation, amplitude_type='decibel', n_level=15)
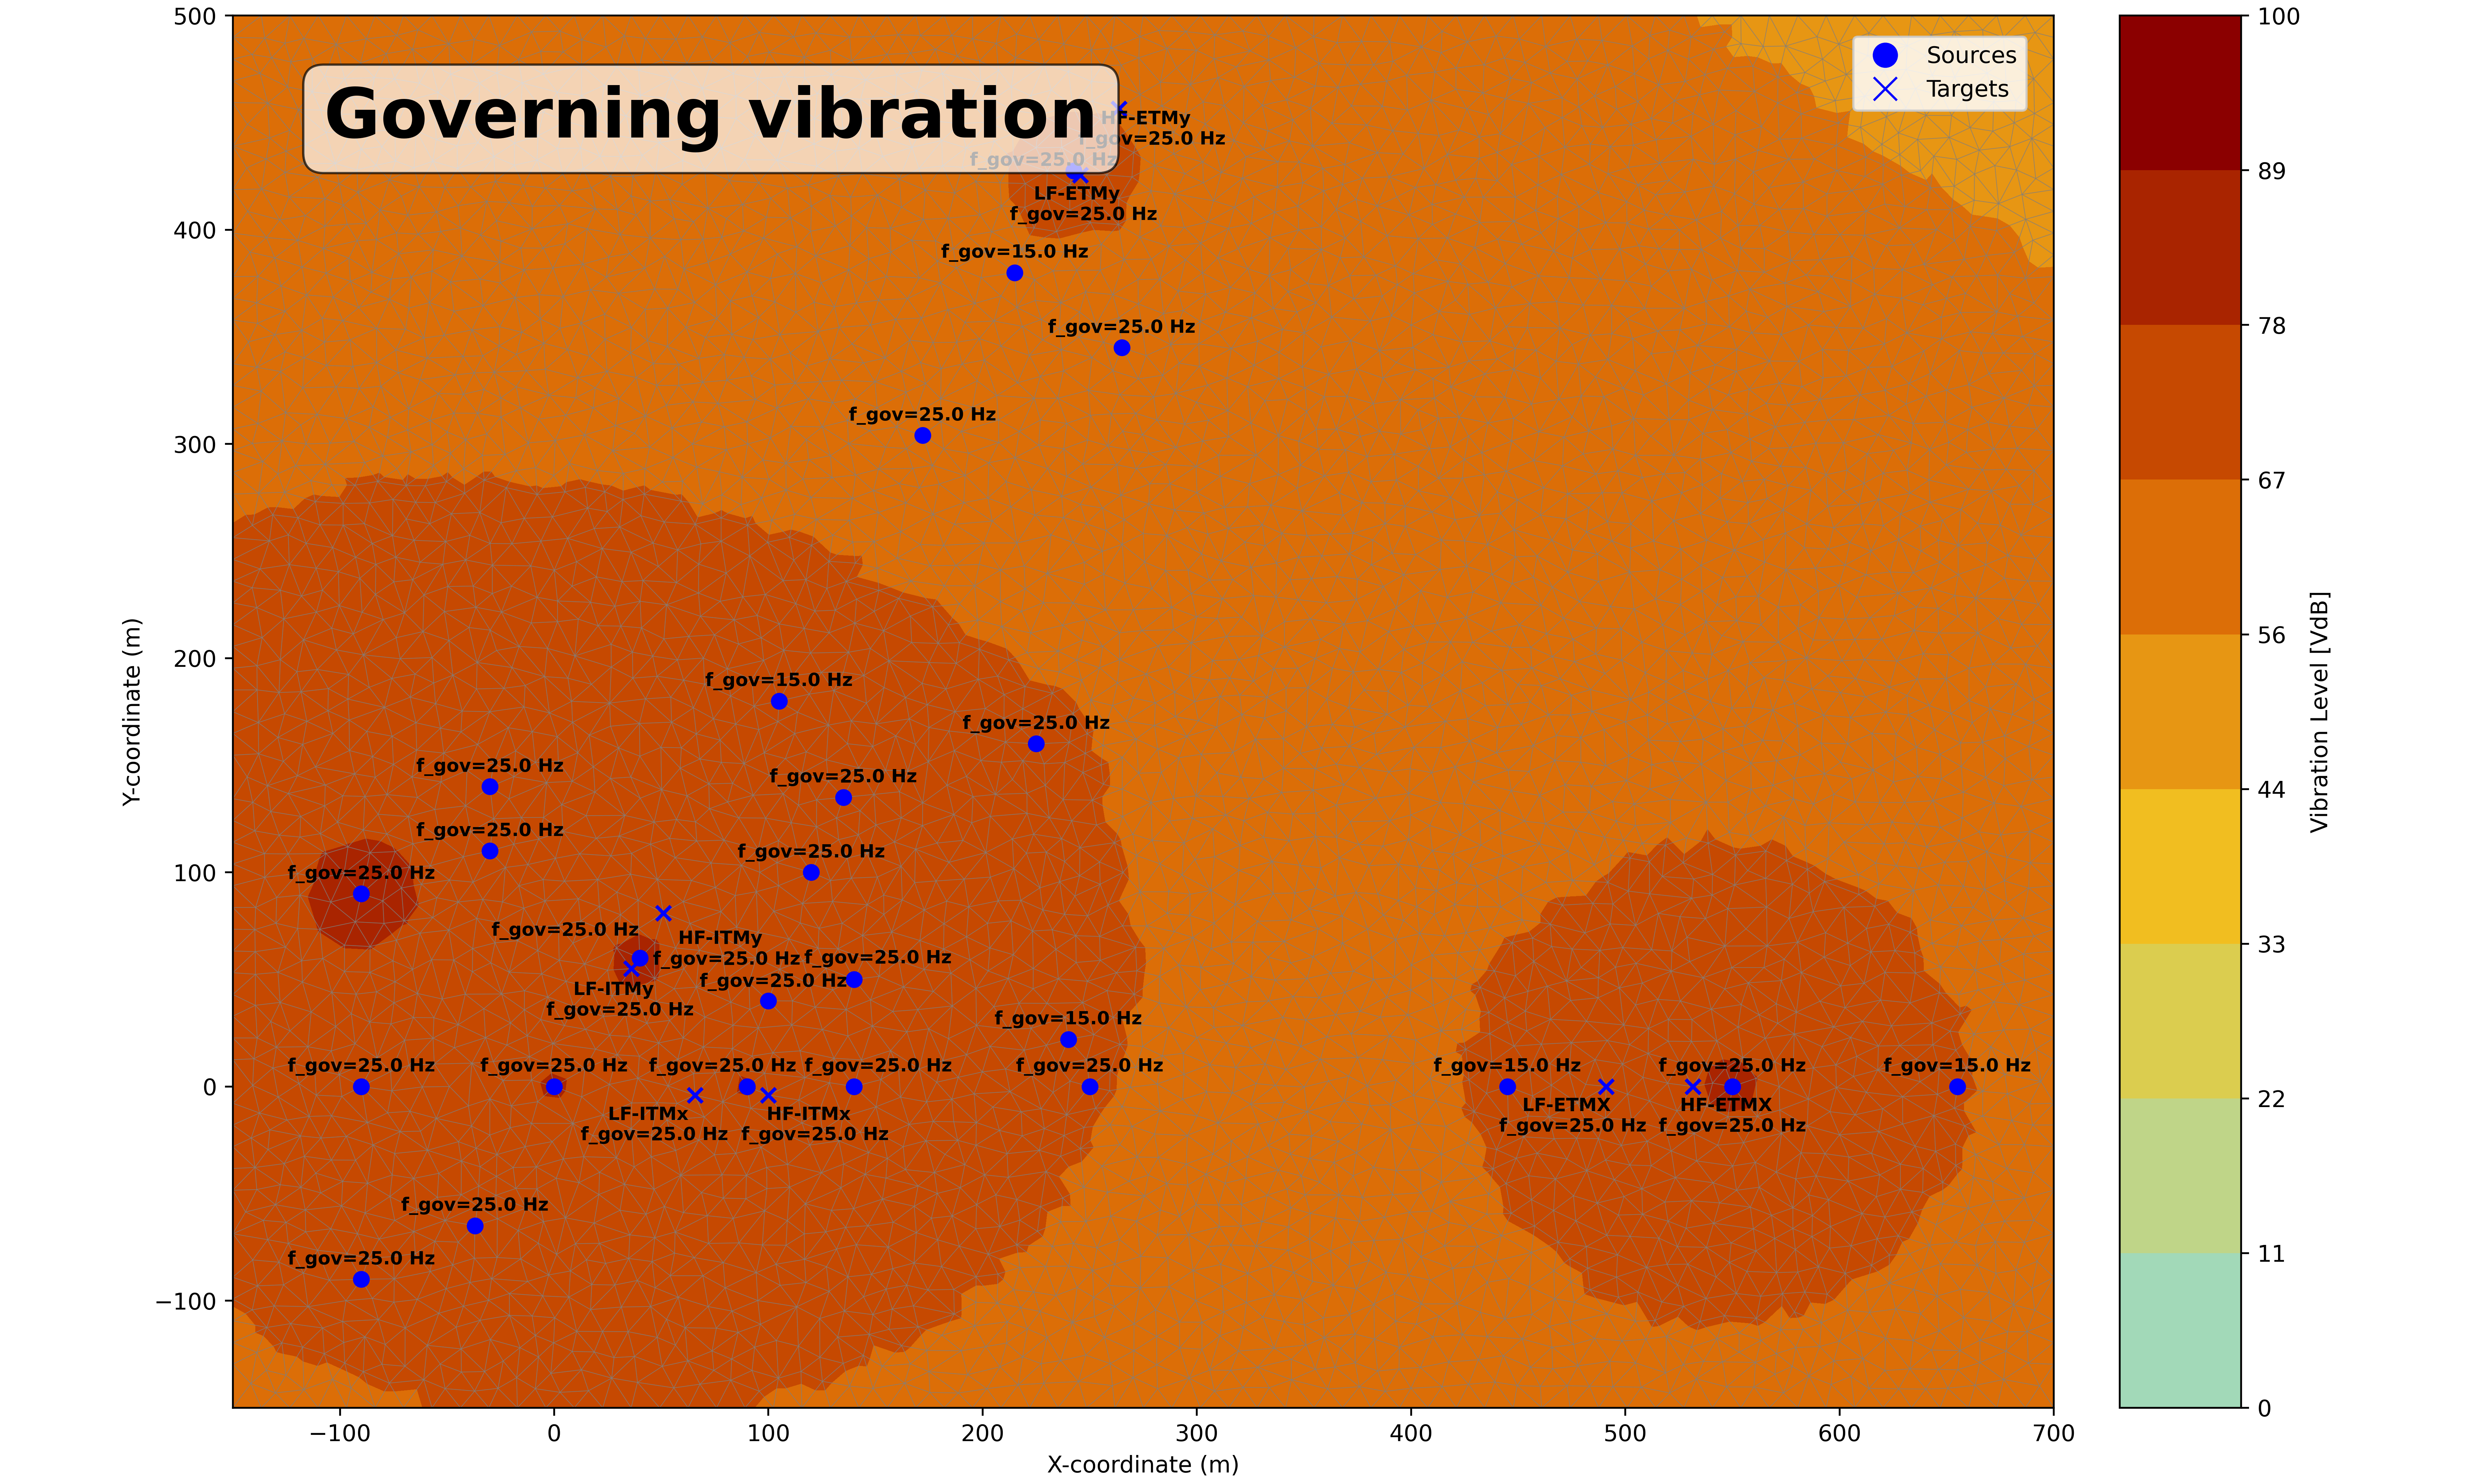
Example plot of the governing contour plot.
The contour plot can also be created per frequency, with the option to align the colour bar:
project.plot_contour(
    vibration_simulation=vibration_simulation, amplitude_type='decibel', align_colour_bar=True,
    n_levels=15, at_frequencies=[10, 20, 40, 60])
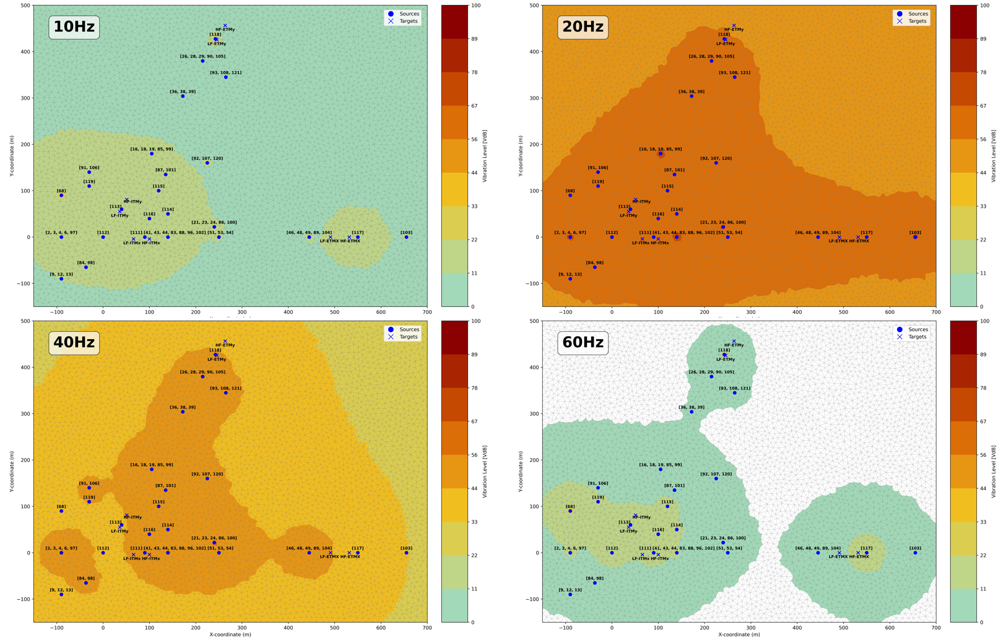
Example plot of the contour plot at requested frequencies.
Background information
This section provides a brief theoretical overview of vibration simulation concepts to help you better understand the tool’s methods and capabilities. It also supports selecting the most suitable settings for your specific use case.
References
The following sections provide detailed documentation of the available classes, methods, and functions within the vibration contour plot tool.